Request Demo

A Year In Review 2024

ARTIST MERCH EDITION

Umbrella Metrics

for industry
$10.24
Average $/Head
$32,061
Avg. Total Gross Merch Sales Per Show (all sizes)
Country
Genre With Most Shows
2,929
Avg. Show Attendance
K-Pop
Genre With Highest Avg. $/Head
517
Avg. # of Items Purchased Per Show
Rock
Genre With Highest Avg. Attendance
Average $/Head

For Industry

2025

$10.24

2024

$9.90

YoY

+3%

Insight:

2025 experienced a slight increase in average per person, rising by 3% compared to the previous year. The growth is mainly seen in smaller venue capacities, while larger venues saw a slight decline in average per person.

Average $/Head

by top 15 genres
Average Gross Sales By Show

By Genre

Average $/Head

Top 5 Genres

K-Pop: $37.41

(Avg. $/Head)

EDM: $15.30

(Avg. $/Head)

Hip Hop/Rap: $15.16

(Avg. $/Head)

Pop: $13.15

(Avg. $/Head)

Metal: $12.34

(Avg. $/Head)

Percentage Of Attendees Buy Merchandise

Broken Down By Genre

K-Pop continues to be a dominating genre for both sales and fan interest in merchandise. EDM has jumped up to the second spot by average per head, focused on smaller size venue EDM shows. Metal continues to show strong interest in merchandise with folk and country showing slight declines to prior year.

Insight:
  • 21% of fans buy merchandise at concerts, comparable to prior year (20% in 2024, 21% in 2023)
  • Shows under 3k saw an increase in volume compared to prior years, up to 7ppt compared to 2023
  • Stadium attendance continues to show elevated percentage of fans buying merchandise, with small- and mid-cap sized attendance also seeing an increase from prior year
Show Breakdown By Attendance Grouping

For All Shows In 2024

26%
1-500
33%
501-1500
15%
1501-3000
8%
3001-5000
9%
5001-10k
5%
10001-15k
2%
15001-20k
3%
20001+
Average $/Head By Attendance Grouping

Top 5 Genres

Streaming VS Merchandise

Avg. Stream = $0.00318 & 1 Band Tee = $36

11,320

streams

=

1

band tees

Avg. Yearly Streaming Revenue

Based On Spotify Published Metrics*

$625

Avg. Nightly Merch Revenue

From A Single ShowIn 2025 (<1,500 Capacity)

$6,799

Percentage Of Total Gross Merch Sales

From The Top Selling 3 Items

63%

26%
1-500
33%
501-1500
Number Of Unique Items Brought Into A Show

Based On All atVenu Counts In Sheets

1
Las Vegas, NV

$/Head: $13.86

Avg. Attendance: 697

2
Las Vegas, NV

$/Head: $13.86

Avg. Attendance: 697

3
Las Vegas, NV

$/Head: $13.86

Avg. Attendance: 697

4
Las Vegas, NV

$/Head: $13.86

Avg. Attendance: 697

5
Las Vegas, NV

$/Head: $13.86

Avg. Attendance: 697

6
Las Vegas, NV

$/Head: $13.86

Avg. Attendance: 697

7
Las Vegas, NV

$/Head: $13.86

Avg. Attendance: 697

8
Las Vegas, NV

$/Head: $13.86

Avg. Attendance: 697

9
Las Vegas, NV

$/Head: $13.86

Avg. Attendance: 697

10
Las Vegas, NV

$/Head: $13.86

Avg. Attendance: 697

11
Las Vegas, NV

$/Head: $13.86

Avg. Attendance: 697

12
Las Vegas, NV

$/Head: $13.86

Avg. Attendance: 697

13
Las Vegas, NV

$/Head: $13.86

Avg. Attendance: 697

14
Las Vegas, NV

$/Head: $13.86

Avg. Attendance: 697

15
Las Vegas, NV

$/Head: $13.86

Avg. Attendance: 697

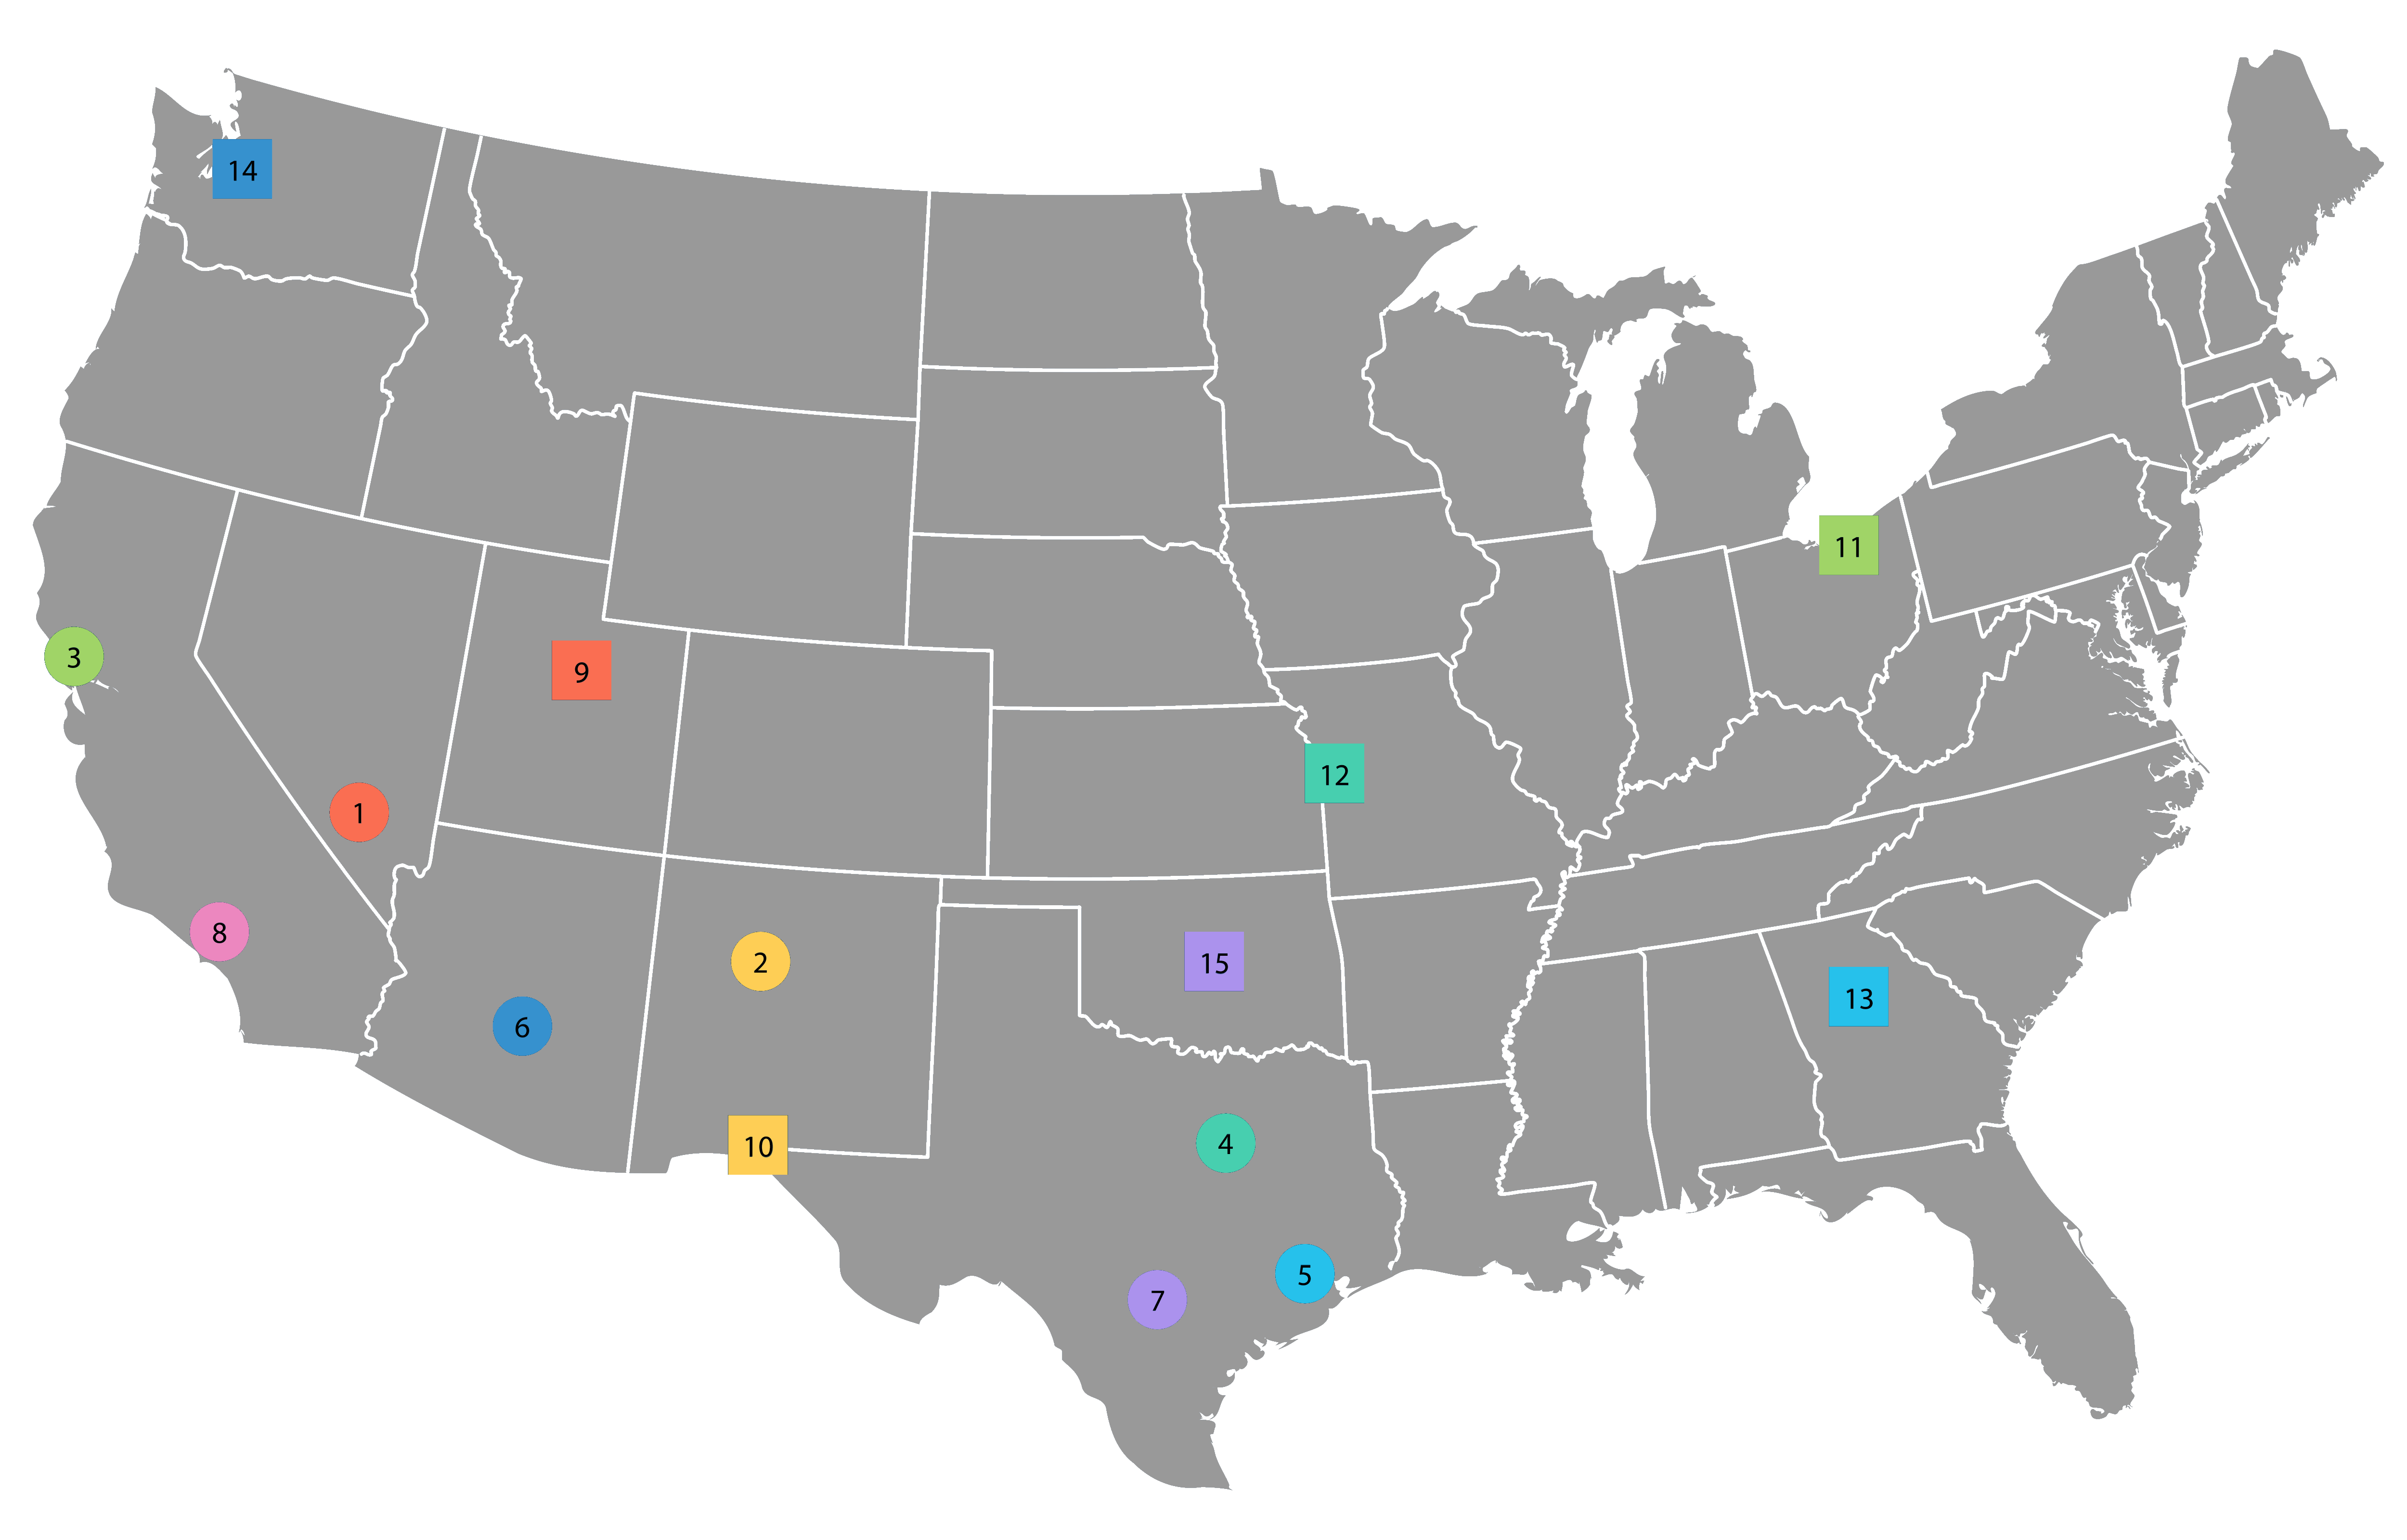
Rankings are determined based on settled atVenu shows from an artist account and taking the average $/head of all shows in that market. Cities with less than 100 shows are excluded. Phoenix, Dallas, Chicago and Detroit are a consolidation of surrounding cities and grouped as one market.

* Avg. Yearly Streaming Revenue per artist = total royalties distributed to artists / total artists on their platform ($5B / 8M)
Spotify published metrics can be found
here regarding the total royalties distributed to artists in 2020 ($5B+) and here for the number of estimated artists on their platform in 2020(~8M+). Our numbers are estimates and not official numbers from Spotify.

Top Selling Items

Of 2024

1

T-Shirt

$37.00

56% of all items sold

2

Heading

$37.00

6.5%

3

Heading

$37.00

5.5%

4

Heading

$37.00

3.5%

5

Heading

$37.00

3.4%

6

Heading

$37.00

2.5%

7

Heading

$37.00

2.3%

8

Heading

$37.00

2.2%

9

Heading

$37.00

2.1%

10

Heading

$37.00

1.6%

Top T-Shirt Colors

Of 2024

53%
Black
11%
White
4%
Natural/Tan
3%
Grey
3%
Red
3%
Blue
23%
All Others

Trends We're Seeing For 2026

  • More Selling Locations = More Revenue: Tours adding trailers, exterior booths, and mobile merch points consistently capture more peak demand.
  • Less Product, Higher Efficiency: Most tour revenue still comes from a handful of hero items.
  • Pop-Ups Change Buying Behavior: Fans buy more when they are not rushed by show timing.
  • Tap To Pay Dominates: Faster payment continues to outperform every other method.
  • Accessories Keep Growing: Small add-ons continue earning a bigger share.
  • Operational Speed Matters as Much as Product Choice: The easiest merch experience usually wins.